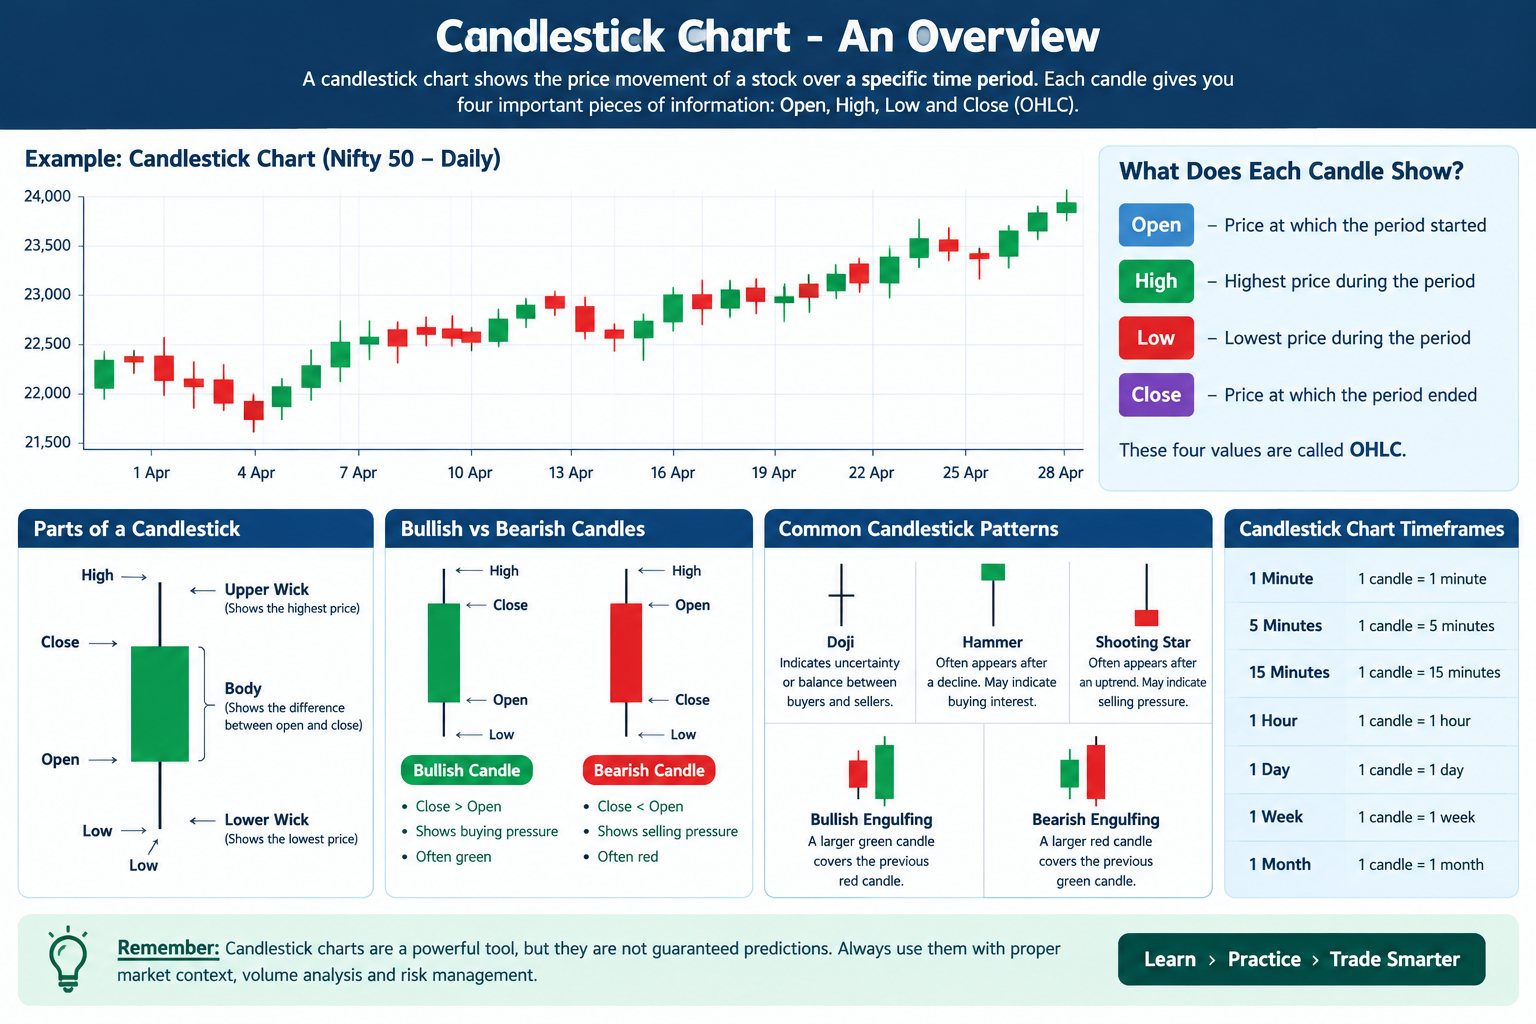
How to Read Candlestick Chart – Beginner's Guide
If you are completely new to the stock market, learning how to read candlestick chart can feel confusing at first. Candles may look like simple red and green bars, but they contain important information about price movement, buying pressure, selling pressure, and market behavior. The good news is that you do not need previous trading experience to understand the basics.
Candlestick charts are widely used by traders and investors to study the movement of stocks, indices, currencies, and other financial instruments. Once you understand the basic structure of a candle, you can start identifying trends and common candlestick patterns more confidently.
In this beginner’s guide, you will learn how to read candlestick chart step by step, understand Open, High, Low, and Close prices, identify bullish and bearish candles, and learn some common candlestick patterns.
What Is a Candlestick Chart?
A candlestick chart is a visual representation of price movement during a specific period. It allows traders to see how the price opened, how high and low it moved, and where it finally closed.
The timeframe determines what one candlestick represents. For example:
1-minute chart: one candle represents one minute
5-minute chart: one candle represents five minutes
15-minute chart: one candle represents fifteen minutes
1-hour chart: one candle represents one hour
Daily chart: one candle represents one trading day
Weekly chart: one candle represents one week
For beginners learning how to read candlestick chart, starting with a daily timeframe can make the learning process easier because there is less short-term market noise.
How to Read Candlestick Chart Using OHLC
To understand how to read candlestick chart, you first need to understand four important price points known as OHLC.
Open: The price at which the trading period started.
High: The highest price reached during that period.
Low: The lowest price reached during that period.
Close: The price at which the trading period ended.
For example, imagine a stock opens at ₹100, reaches a high of ₹115, falls to ₹95, and finally closes at ₹110. These four values create the basic information represented by that candlestick.
Understanding OHLC is one of the most important foundations for anyone learning how to read candlestick chart.
Understanding the Parts of a Candlestick
A candlestick has three main visual parts: the body, upper wick, and lower wick.
1. Candlestick Body
The body represents the difference between the opening and closing price.
If the closing price is higher than the opening price, the candle is generally displayed in green and is called a bullish candle.
If the closing price is lower than the opening price, the candle is generally displayed in red and is called a bearish candle.
2. Upper Wick
The upper wick, also called the upper shadow, shows how high the price moved during the selected timeframe.
A long upper wick can indicate that the price moved significantly higher but later came down before the candle closed.
3. Lower Wick
The lower wick shows how low the price moved during the selected period.
A long lower wick can indicate that the price moved lower but recovered before the candle closed.
When learning how to read candlestick chart, paying attention to wick length can help you understand how buyers and sellers behaved during a particular period.
Bullish and Bearish Candlesticks
One of the easiest ways to understand how to read candlestick chart is to learn the difference between bullish and bearish candles.
Bullish Candlestick
A bullish candle forms when the closing price is higher than the opening price.
For example, if a stock opens at ₹100 and closes at ₹110, it creates a bullish candle. The green body indicates that the price finished higher than where it started.
A bullish candle can indicate stronger buying activity during that period, but it does not automatically mean that the price will continue rising.
Bearish Candlestick
A bearish candle forms when the closing price is lower than the opening price.
For example, if a stock opens at ₹100 and closes at ₹90, it creates a bearish candle.
The red body indicates that the price finished lower than where it started. This can indicate stronger selling activity during that period.
How to Read Candlestick Chart Step by Step
If you have zero trading experience, follow these simple steps to understand how to read candlestick chart.
Step 1: Select a Stock or Index
Start with a stock or market index that you understand. Avoid analyzing dozens of stocks at the same time.
Step 2: Select a Timeframe
Choose a timeframe based on your learning goal. A daily chart is a simple starting point for beginners.
Step 3: Identify the Candle Color
Check whether the candle is bullish or bearish. This immediately tells you whether the price closed higher or lower than it opened.
Step 4: Check the Body
Look at the size of the candle body.
A large body can indicate a strong price movement during that period, while a small body can indicate relatively limited movement.
Step 5: Check the Wicks
Look at the upper and lower wicks. Long wicks can provide information about price rejection and the battle between buyers and sellers.
Step 6: Study Previous Candles
Never analyze a single candle completely on its own. Look at the candles before and after it and consider the overall market trend.
Ask yourself:
Is the price moving upward?
Is the price moving downward?
Is the market moving sideways?
Are buyers becoming stronger?
Are sellers becoming stronger?
This context is extremely important when learning how to read candlestick chart.
Common Candlestick Patterns for Beginners
After understanding individual candles, you can start learning common candlestick patterns.
Doji
A Doji forms when the opening and closing prices are very close.
It can indicate uncertainty or a balance between buyers and sellers. However, a Doji should not automatically be considered a buy or sell signal.
Hammer
A Hammer generally has a small body and a long lower wick.
It can appear after a downward price movement and may indicate that buyers rejected lower prices.
Shooting Star
A Shooting Star usually has a small body and a long upper wick.
When it appears after an upward movement, it can indicate rejection of higher prices.
Bullish Engulfing
A bullish engulfing pattern generally occurs when a smaller bearish candle is followed by a larger bullish candle that covers the previous candle’s body.
Traders may watch this pattern for signs of increasing buying momentum.
Bearish Engulfing
A bearish engulfing pattern is the opposite. A smaller bullish candle is followed by a larger bearish candle that covers the previous candle’s body.
It may indicate increasing selling pressure.
Learning these basic patterns can make how to read candlestick chart much easier because you begin to recognize repeated price-action structures.
Why Are Candlestick Charts Useful?
Candlestick charts provide a simple visual way to study price movement. Instead of looking at a long list of prices, traders can quickly see whether buyers or sellers appeared stronger during a particular period.
Candlesticks can help you study:
Market trends
Buying and selling pressure
Price rejection
Market momentum
Potential reversal areas
Support and resistance
Common price-action patterns
However, candlestick patterns are not guaranteed predictions. A pattern can fail, especially when market conditions change.
Candlestick Charts and Trading Volume
Volume can provide additional information when you are learning how to read candlestick chart.
Suppose a stock makes a strong bullish move while trading volume is also significantly higher. This may provide stronger context than the same price movement occurring with very low volume.
For this reason, many traders study price, candlestick structure, and volume together rather than relying on a single candle. See our blog with Ai generation
Common Mistakes Beginners Should Avoid
Beginners often make several mistakes while learning how to read candlestick chart.
The first mistake is trying to memorize dozens of patterns without understanding basic price action.
The second mistake is assuming that every candlestick pattern will predict the next market move.
Another common mistake is changing timeframes constantly. This can make chart analysis confusing because the same price movement can look very different on different timeframes.
Finally, beginners sometimes make decisions based on one candle without checking the overall trend.
A better approach is to understand the basics first and gradually build your knowledge through practice.
How to Practice Reading Candlestick Charts
The best way to improve is through regular practice.
Open a historical stock chart and select a daily timeframe. Choose different candles and identify their Open, High, Low, and Close values.
Then study the candle body and wicks. Ask yourself what happened during that period.
For example, if a candle has a long lower wick, you can observe that the price moved lower but recovered before closing. Then check the surrounding candles to understand the broader context.
You can also practice identifying Doji, Hammer, Shooting Star, and Engulfing patterns using historical charts. Practicing with past market data allows you to learn without immediately risking real money.
Final Thoughts
Learning how to read candlestick chart is an important starting point for anyone interested in technical analysis. You do not need previous stock market experience to begin. Start by understanding OHLC, candle bodies, upper and lower wicks, and the difference between bullish and bearish candles.
Once the basics are clear, gradually learn common candlestick patterns such as Doji, Hammer, Shooting Star, and Engulfing patterns. Then add concepts such as market trends, support and resistance, and volume.
Remember that candlestick charts are tools for understanding market behavior, not guaranteed prediction systems. A single candle or pattern should not be treated as a certain buy or sell signal.
With consistent practice and proper risk management, you can become more comfortable reading charts and understanding what price action may be communicating.